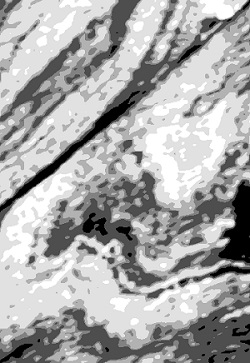
Figure 1. Electromagnetic data from the Iditarod and Beaver Creek surveys, 7200 Hz apparent resistivity grid; image scale approximately 12 miles wide.
Electromagnetic surveys record electric fields and/or changing magnetic fields. These recorded signals can be generated by active or natural sources. Example active sources are a loop wire with current flow or current put into the ground using metal electrodes. Thunderstorms are an example of a natural source. The recorded electromagnetic data are a function of the subsurface resistivity. Rock type, alteration, saturation, temperature, and other physical properties determine the resistivity of the subsurface. Most DGGS electromagnetic data provide a depth of exploration of approximately 100 meters. Some electromagnetic methods have a depth of exploration of kilometers. In Figure 1 of electromagnetic data from the Iditarod and Beaver Creek surveys, the Nixon-Iditarod Fault is the thick straight black area that cuts the image from middle left to upper right. Folded stratigraphy is visible in the lower third of the image.
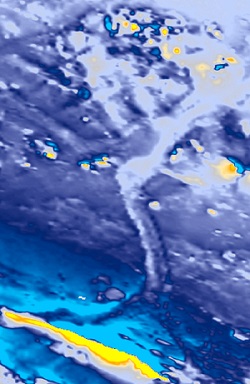
Figure 2. Magnetic data from the Tok survey, residual magnetic intensity grid; image scale approximately 12 miles wide.
Magnetic surveys record the Earth's magnetic field intensity to map lateral variations of magnetic properties, namely magnetic susceptibility and remanence. These lateral variations of magnetic properties are a direct reflection of different types of rocks, faults, and alteration. Most magnetic surveys in the DGGS collection provide information about the subsurface to a depth of a few kilometers. In Figure 2, strongly magnetic ultramafic rocks bright lines are featured in the bottom of image. Tok and Little Tok River drainages run through the middle. Magnetic gabbros intrusive rock bodies appear in the upper half of the image as bright areas.

Figure 3. Reflection seismic data cross section, approximately 5 miles wide. Image credit: Division of Oil and Gas.
P-waves and sometimes S-waves are recorded in a reflection seismic survey. The seismic waves are generated from a variety of active sources including explosives, vibroseis, and air guns. These signals are recorded as a function of time in many locations for a survey. The amplitude and timing of the returning (or reflected) waves are a function of the subsurface acoustic impedance which is the product of seismic velocity and density. Rock type, density, consolidation, clast size, hydrocarbon content, saturation, and more determine the acoustic impedance properties of the subsurface. The State of Alaska Tax Credit Seismic Surveys for Public Release provide information that usually extends from surface to geologic basement. Figure 3 depicts reflection seismic data of line JJ' (19742) of pre-stack time migration (PSTM) and EES Full Stack of the Harrison Bay CP 3D Survey. Vertical scale is in milliseconds (time) and roughly represents 11000 feet. Layered stratigraphy and the Fish Creek Slump (circled) are visible in the data.
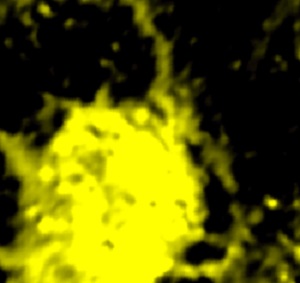
Figure 4. Radiomteric data from the Farewell survey, equivalent Thorium percent Potassium grid; image scale is approximately 6 miles across.
The naturally occurring harmless gamma ray spectra is recorded during a radiometric survey. Different radioactive elements have unique gamma ray spectral values. Trace amounts of radioactive elements emitting harmless low levels of gamma ray energy can be used to differentiate rock type and surficial material. Radiometric surveys are only sensitive to the first centimeters of material; therefore rely on areas with near surface bedrock. Figure 4 represents radiomteric data from the Farewell survey, where the bright area is intrusive rocks with elevated Thorium levels. These rocks stand out from the adjacent sedimentary and metamorphic rocks.
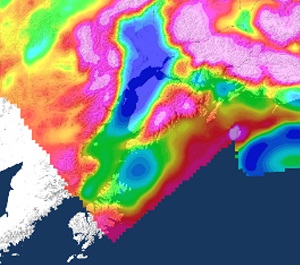
Figure 5. Gravity data of Cook Inlet, free-air disturbance grid; image is approximately 500 miles across.
Typically the vertical component of the earth's gravity field (vertical or gravitational acceleration) is measured during a gravity survey. Airborne gravity gradiometry surveys measure the gravity gradients of the earth's gravity field. Gravity surveys measure the Earth's gravity field intensity to map lateral variations of rock density. These lateral variations of densities are a direct reflection of different types of rocks, faults, folds, and alteration. Example applications include mapping the thickness of unconsolidated materials in valleys, identifying favorable hydrocarbon exploration structure, interpreting regional structure, and targeting of some dense ores. Most gravity surveys provide information about the subsurface to a depth of a few kilometers. In Figure 5, the hydrocarbon producing Cook Inlet sedimentary basin is visible as cool colors in the central portion of the image.
General Inquiries
Email: dnr.dggs.geophysics@alaska.gov
Logan A. Fusso
Geophysics Program Manager
Phone: 907-451-5060
Email: logan.fusso@alaska.gov

Eric I. Petersen
Geophysicist, Geophysics Program
Phone: 907-334-4408
Email: eric.petersen2@alaska.gov